Make Data Accessible for All
Data Analyst | Excel | Python | R | SQL | Tableau | Power BI | TESOL-certified Teacher
Raw data is complex and hard to grasp.
I aim to transform it and uncover meaningful discoveries.

Data Analyst | Excel | Python | R | SQL | Tableau | Power BI | TESOL-certified Teacher
Raw data is complex and hard to grasp.
I aim to transform it and uncover meaningful discoveries.

I am a data analyst based in Birmingham, UK, skilled at transforming unstructured data into actionable insights using Excel, Python, R, SQL, Tableau, Power BI, and machine learning. With a meticulous and problem-solving mindset, I specialise in identifying patterns, streamlining processes, and delivering clear, data-driven solutions. My logical thinking and methodical approach to challenges ensure meaningful and practical results for diverse audiences.
Drawing on my experience as a TESOL-certified teacher, I have honed the ability to communicate complex concepts clearly and effectively, making technical data accessible to non-expert stakeholders. This skill set allows me to tailor information to meet the needs of different audiences while ensuring clarity and engagement. Known for my curiosity, persistence, and attention to detail, I am dedicated to solving challenges, refining my technical expertise, and adapting to the ever-evolving landscape of data analytics.

Coursework Highlights from the University of Birmingham, October 2023 Cohort
Explore 4 projects and 17 challenges showcasing skills in data analysis, visualisation, and statistical modeling. Includes project overviews, GitHub links, and screenshots of key outputs.

Personal GitHub Projects
This hub features diverse GitHub repositories, from data analytics projects to experiments and full applications across various domains. It includes project summaries, repository links, screenshots of outputs and methods, and highlights key skills demonstrated in each task for a quick yet comprehensive overview.
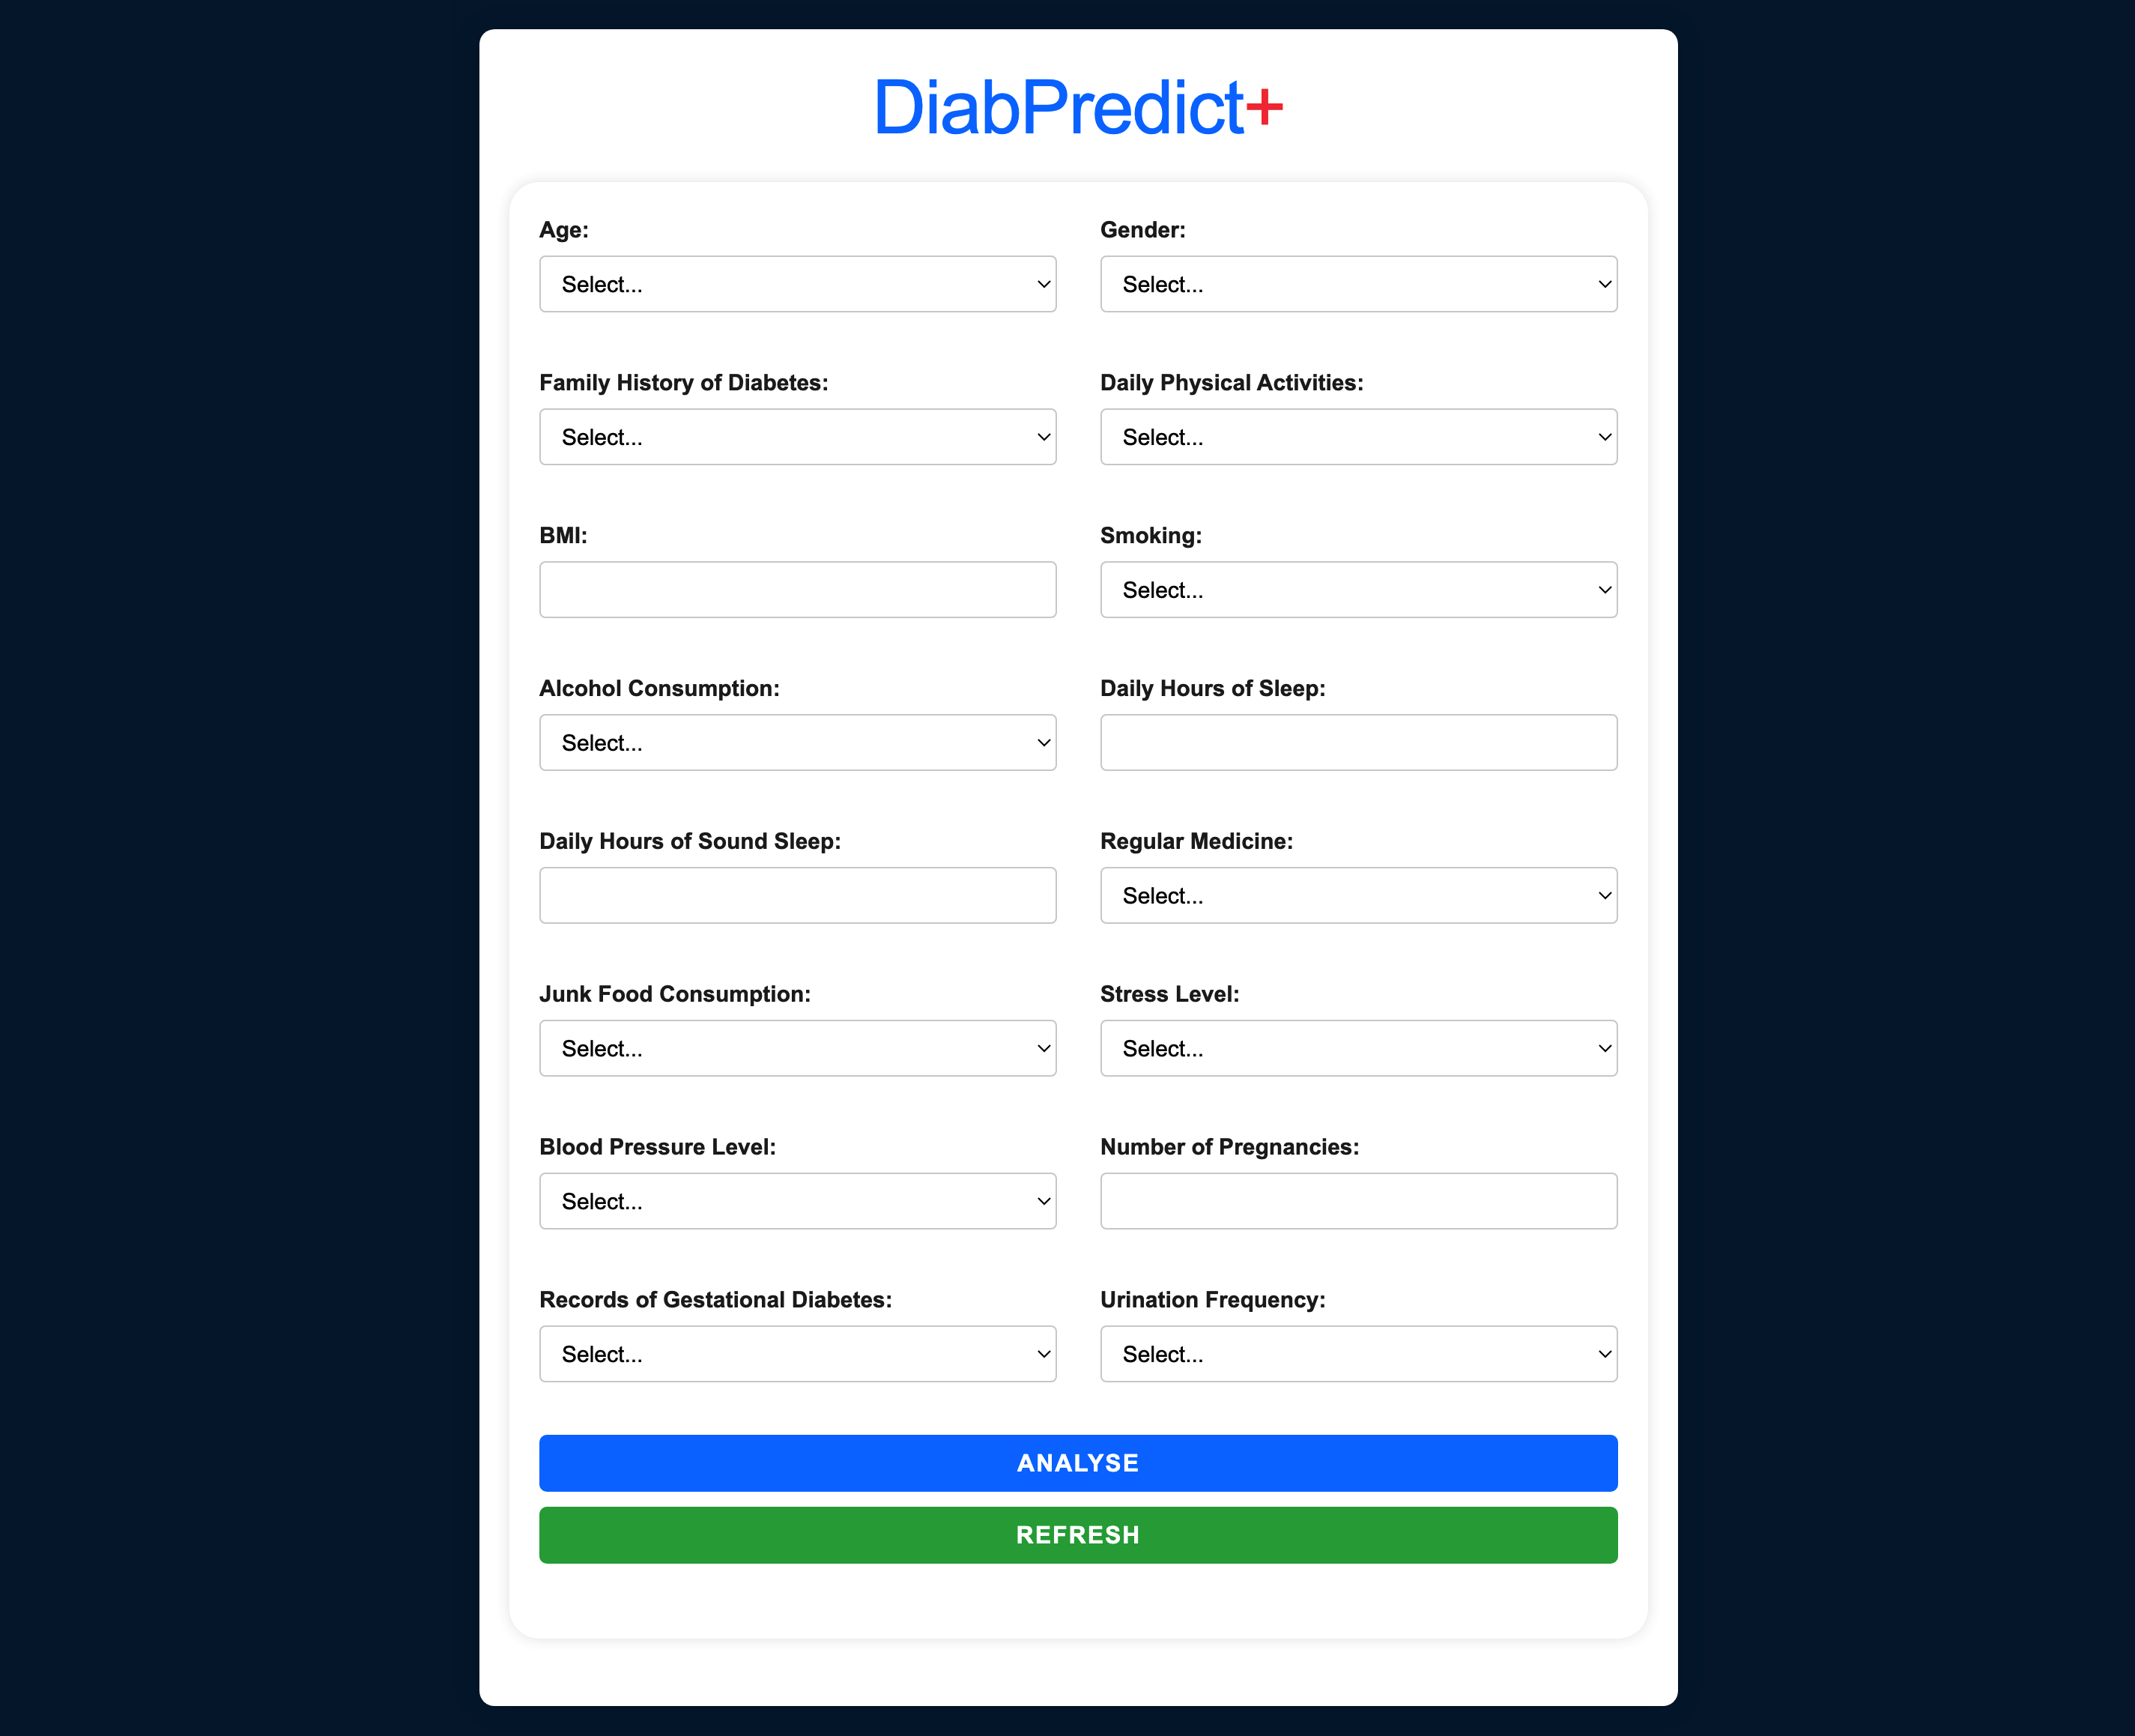
Developing a Diabetes Risk Prediction Model using Machine Learning
The model analyses anonymised health records to uncover key risk factors for diabetes. A user-friendly web application allows users co input health parameters and receive diabetes risk predictions, supporting early detection and improved public health management.
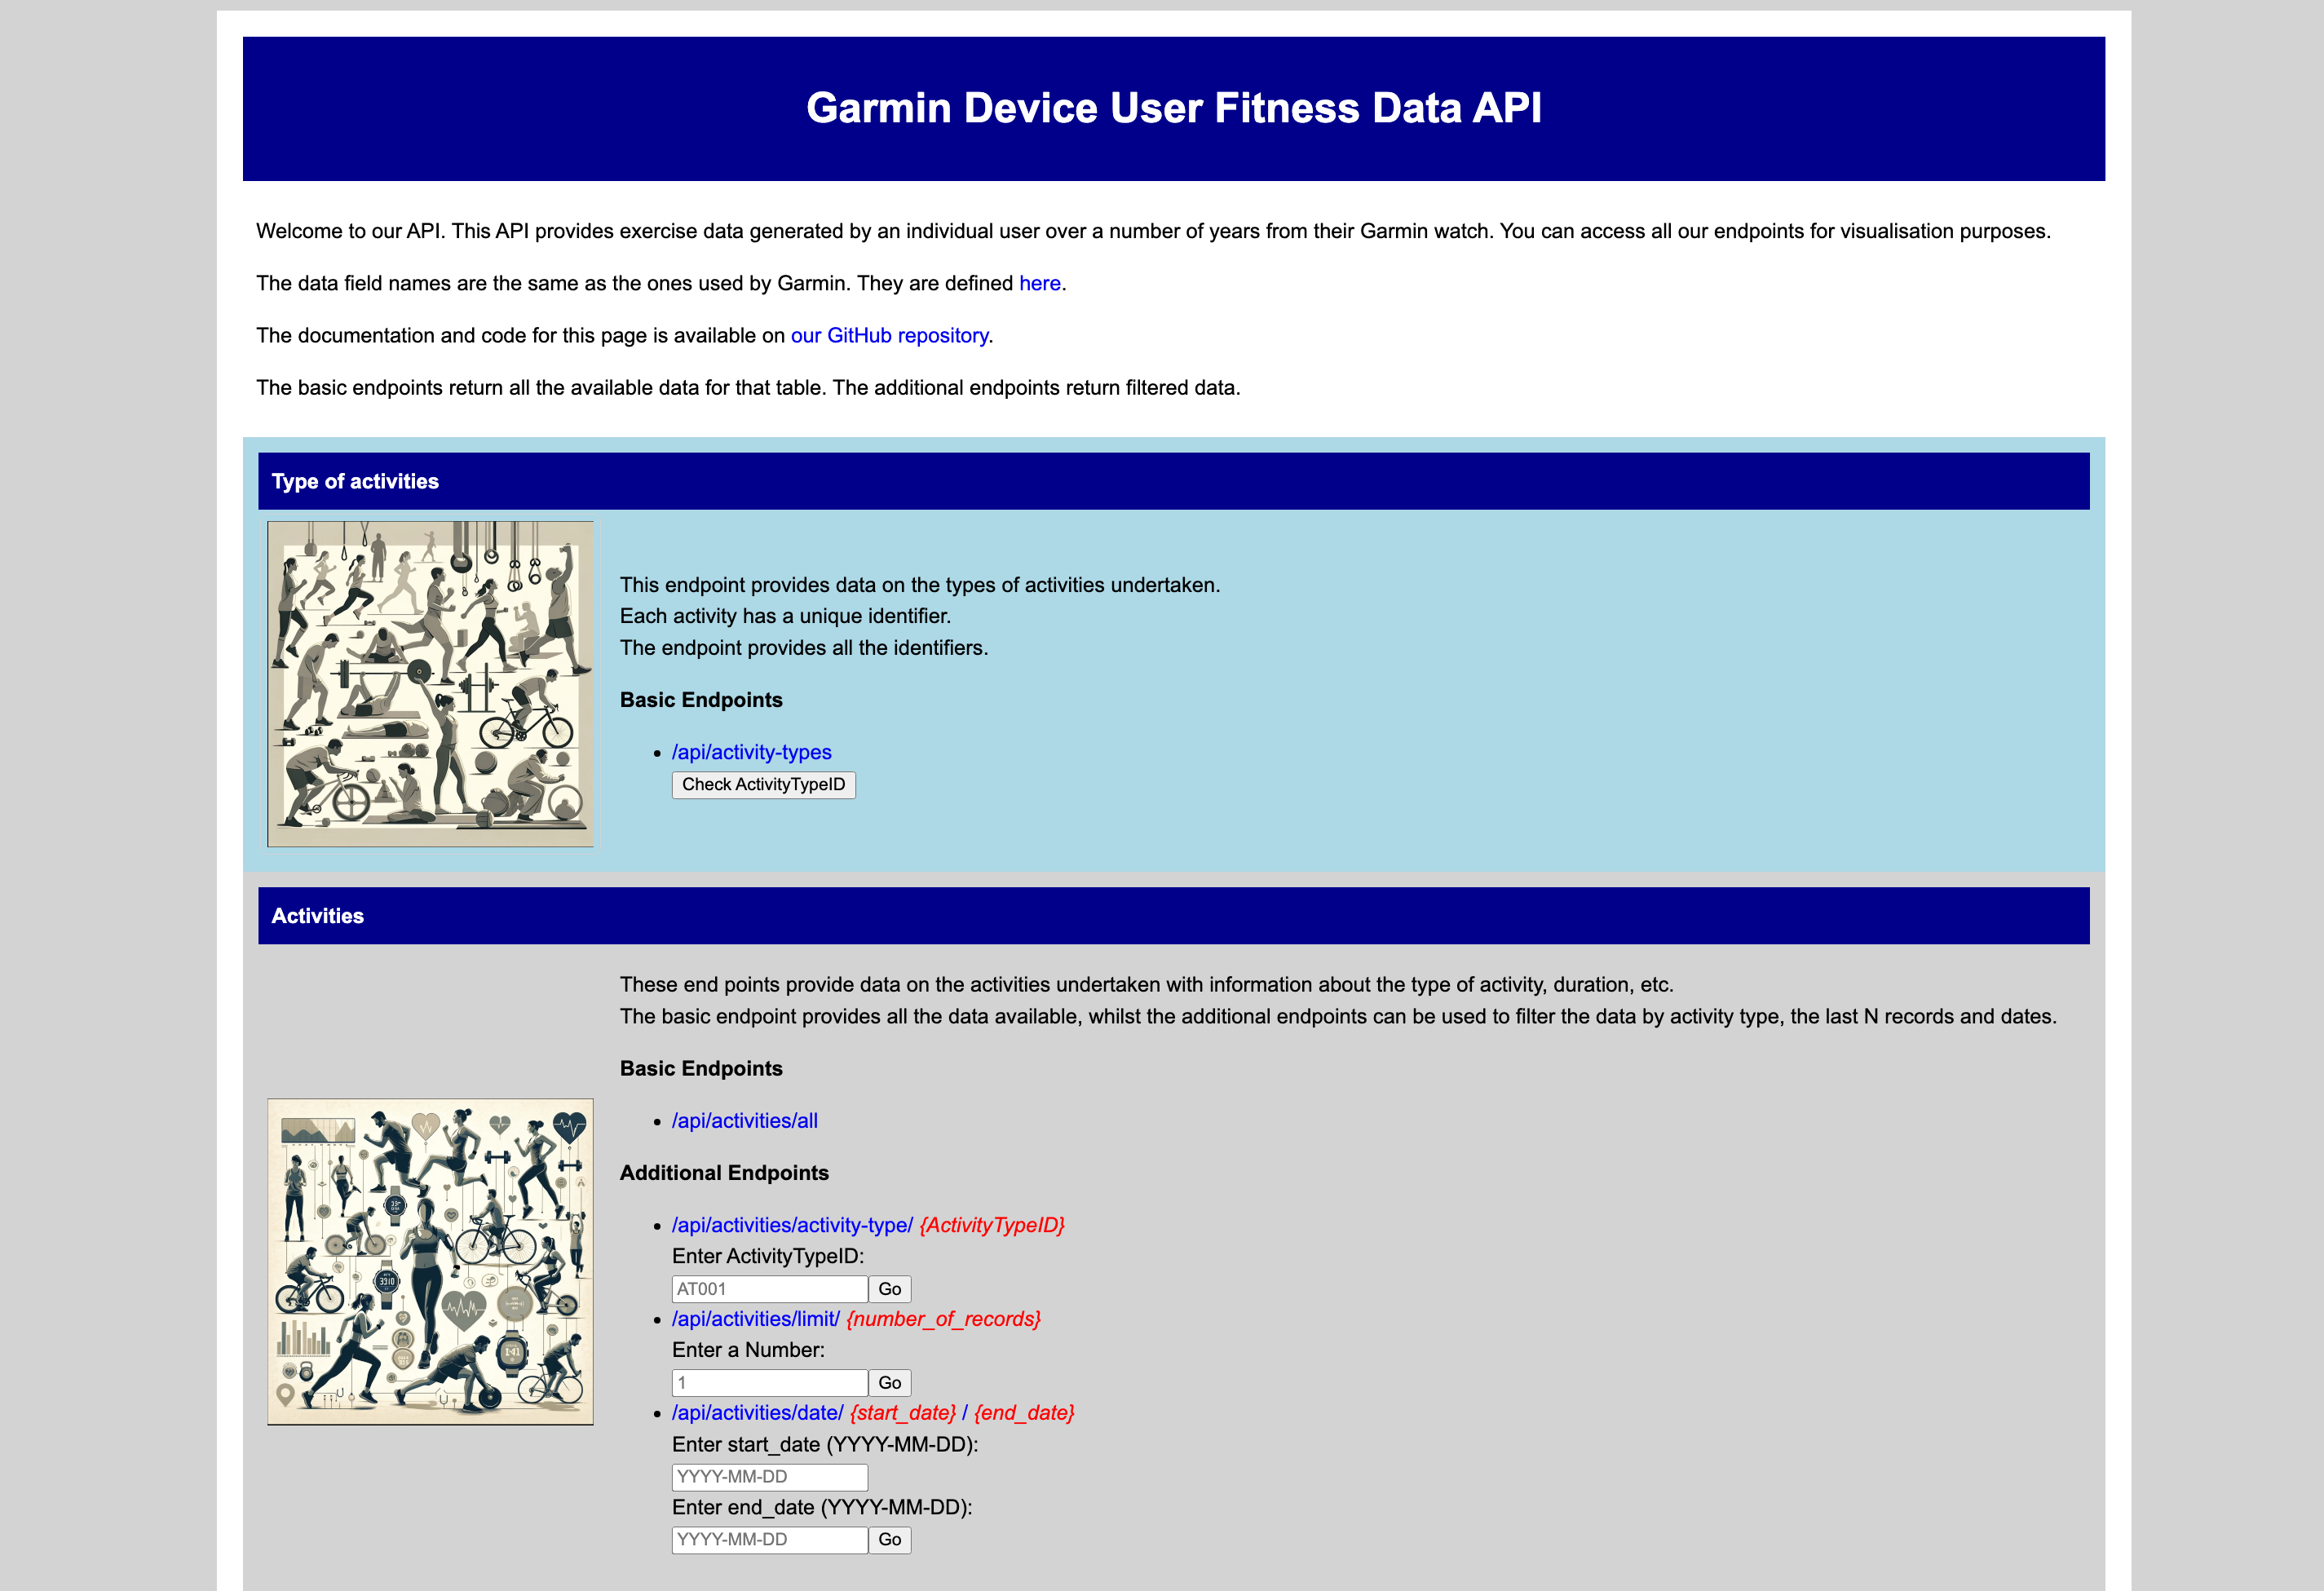
A Solution to Analyse Fitness Patterns from Garmin Wearable Data
This project implements a scalable Extract, Transform, Load (ETL) workflow to process Garmin fitness data into a structured relational database, enabling efficient queries. It supports analysis through pandas and a Flask API, empowering users to optimise fitness strategies with data-driven insights.
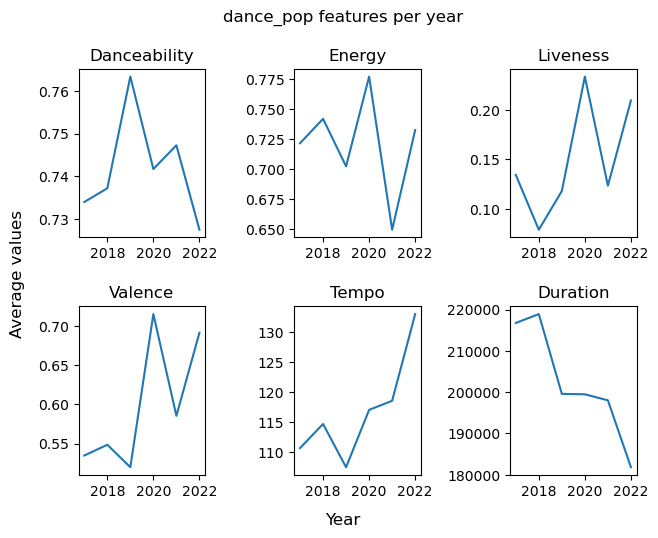
Analysis of Music Habits from 2017 to 2022
Using Spotify's yearly top 100 playlists, this project examines the impact of COVID-19 and TikTok's rise on global music habits. Track data was collected via the Spotipy API and integrated into a structured dataframe. After data cleaning and validation, exploratory analysis identified trends in song duration, genre shifts, and feature changes.
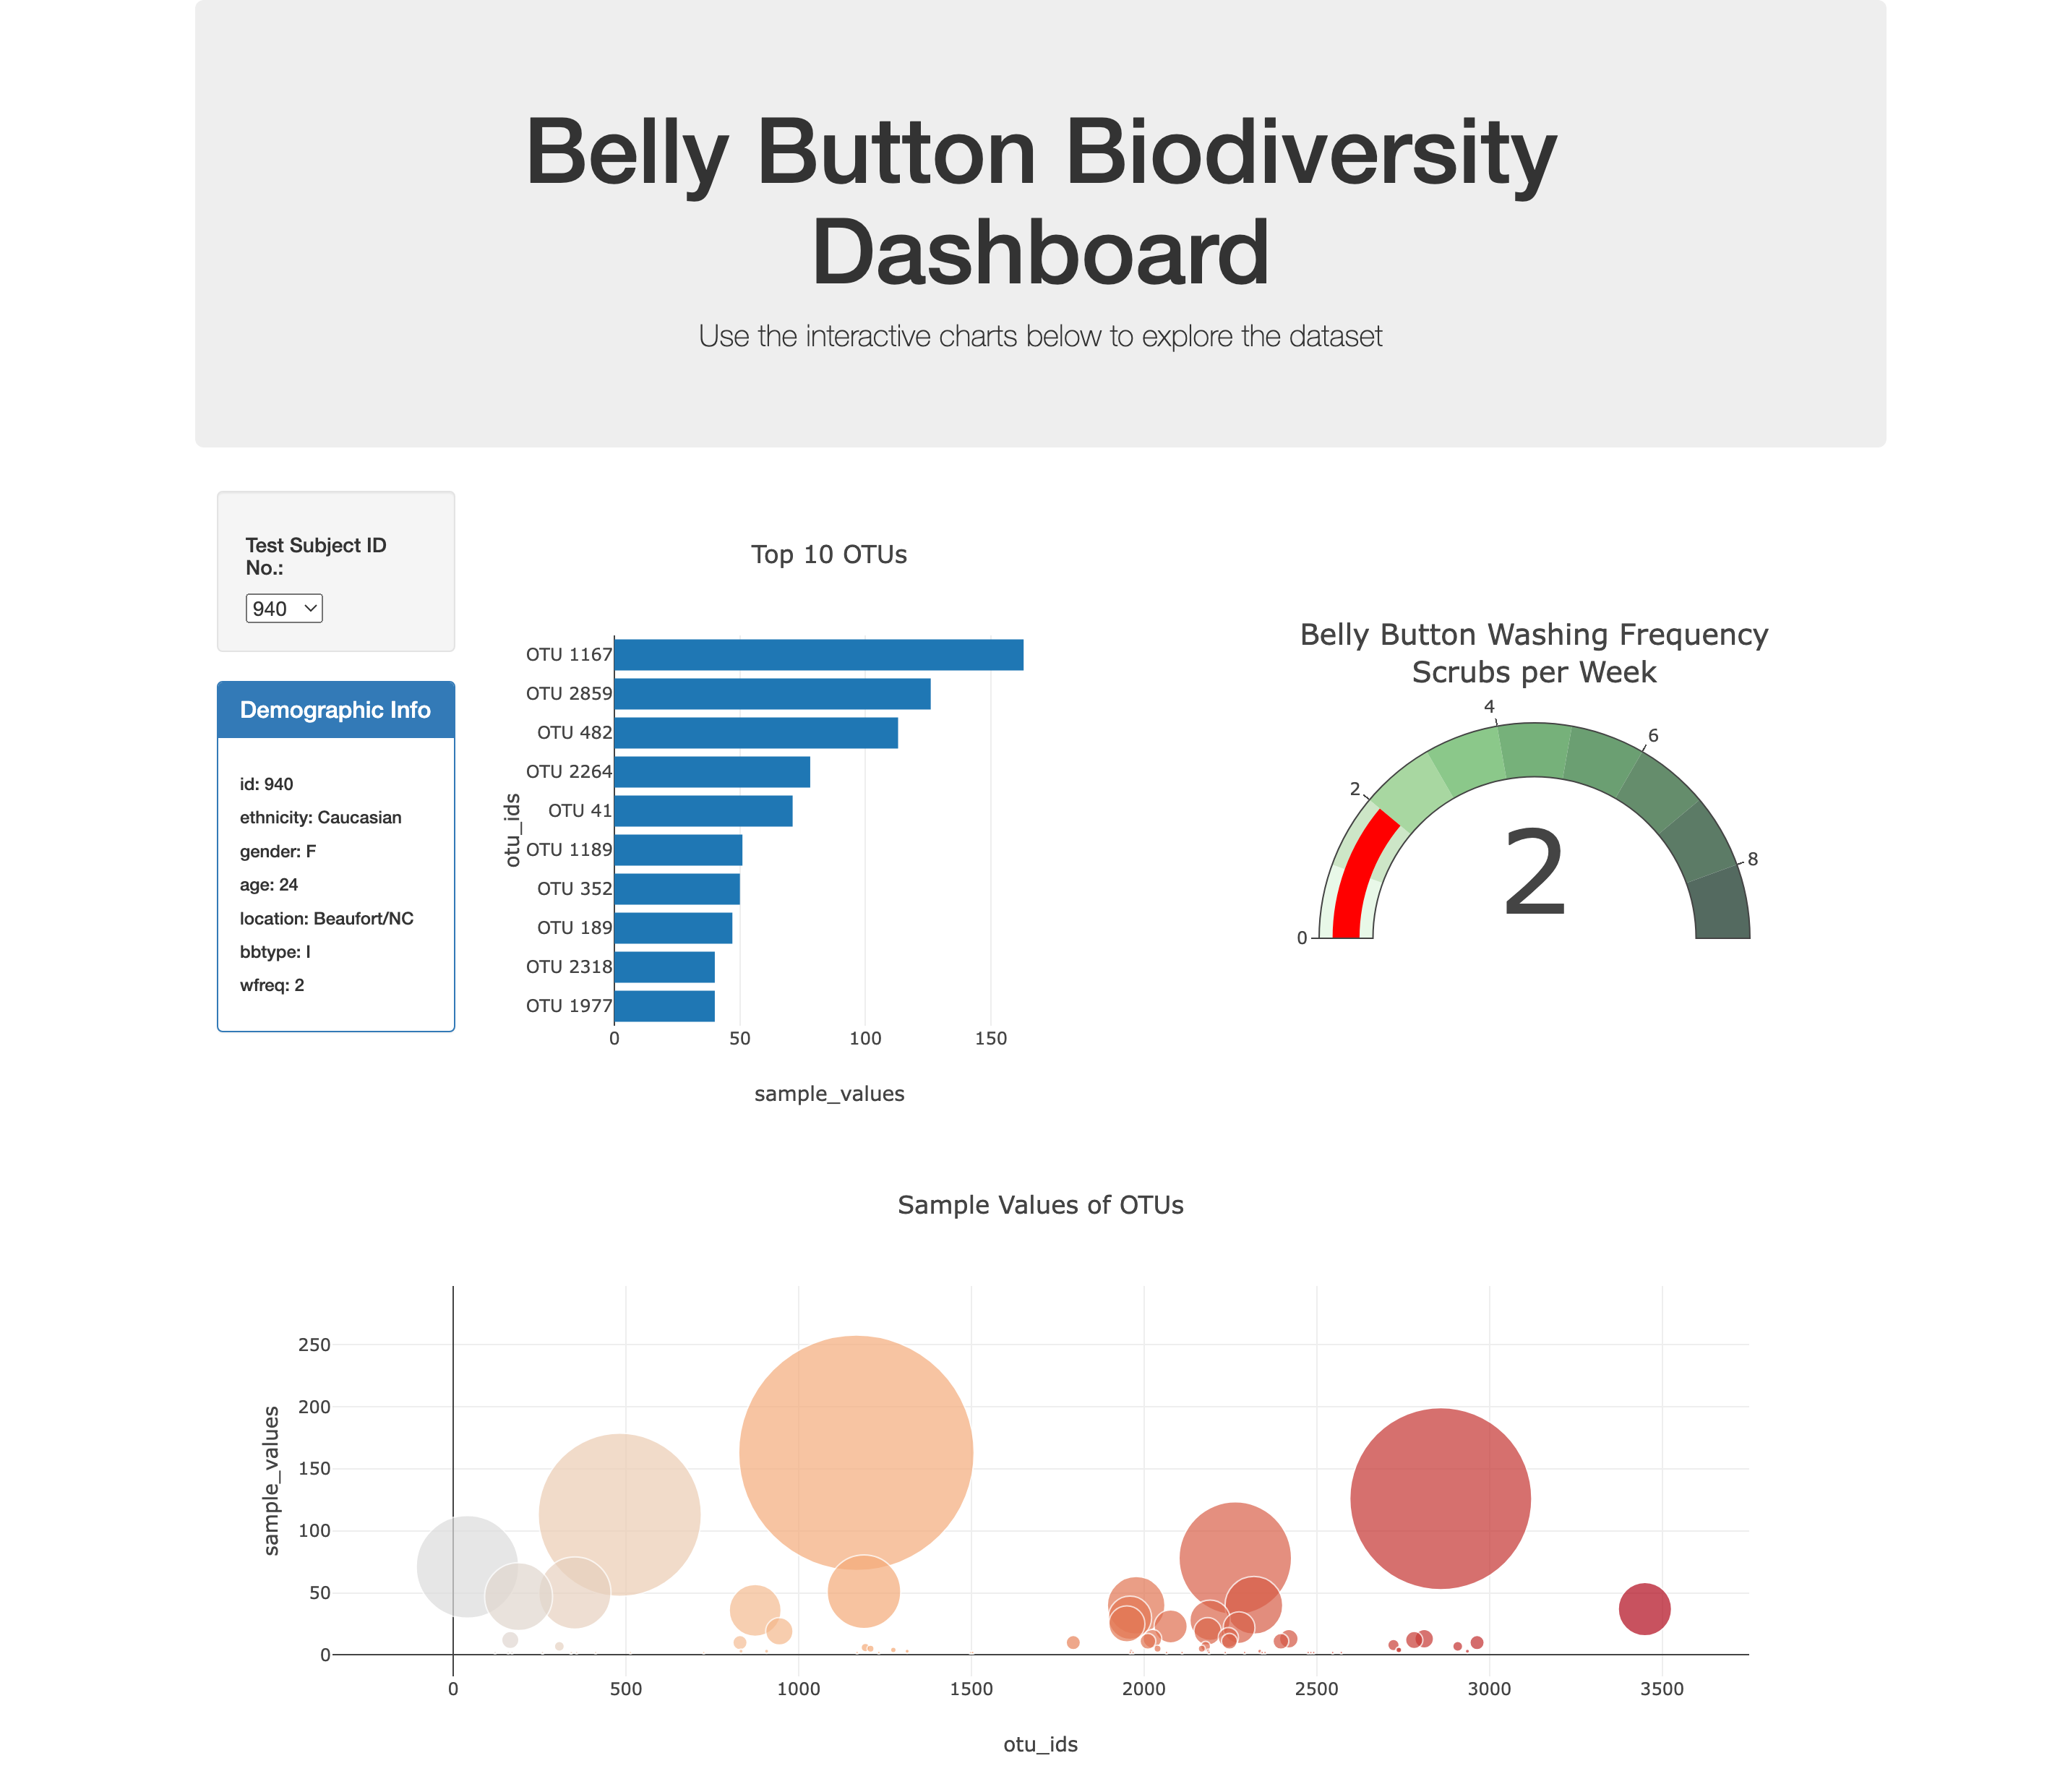
Interactive Web Tool for Data Visualisation
This dashboard, developed using HTML, CSS, JavaScript, D3.js, Plotly.js, and Bootstrap, enables users to analyse microbial diversity through dynamic visualisations like bar and bubble charts. It also showcases demographic metadata linked to each sample, offering an engaging way to explore microbiome variation.
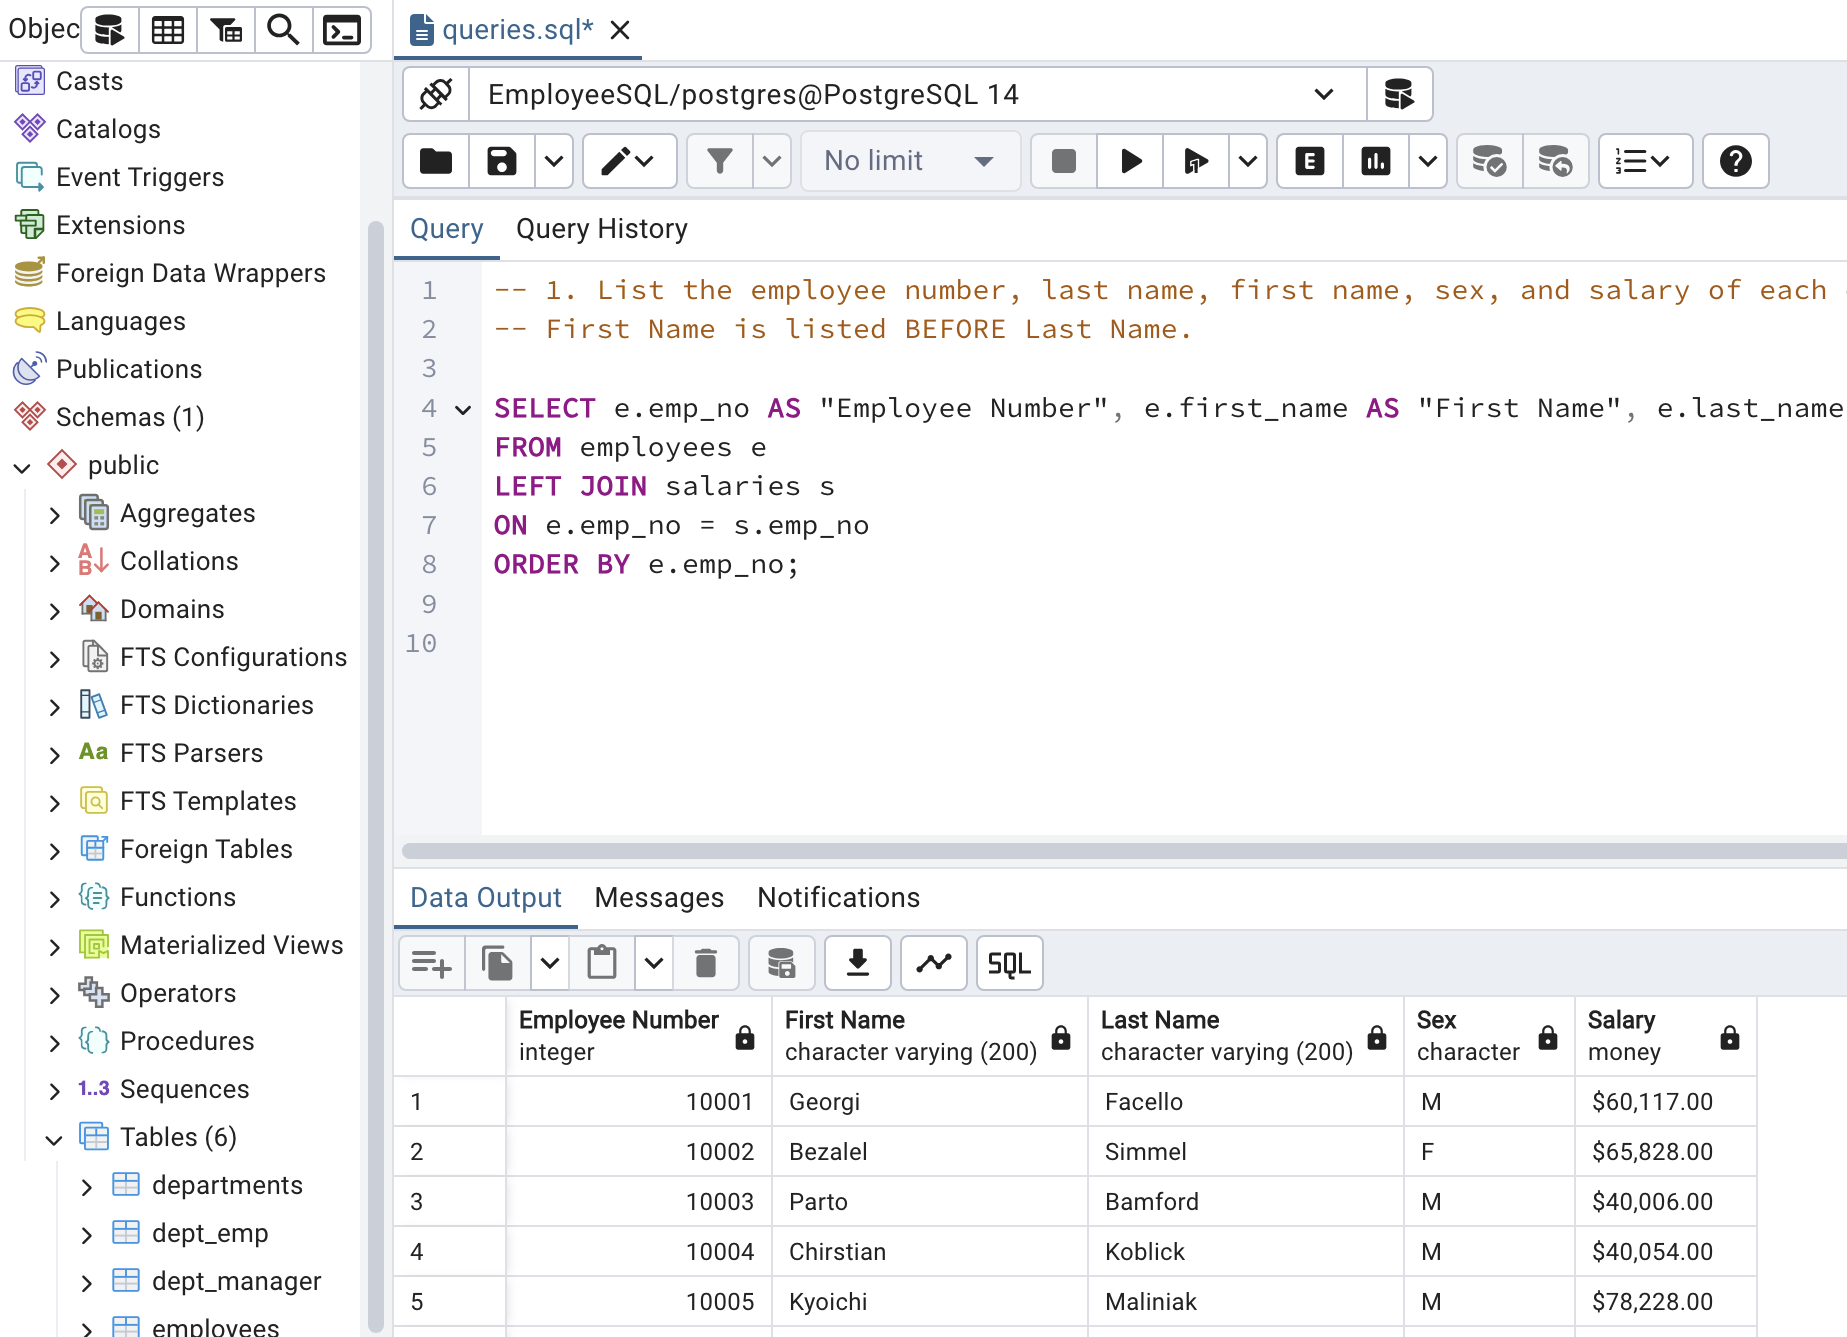
PostgreSQL Database Setup and Queries
This challenge analyses historical employee data for a company using PostgreSQL. The objectives include designing an Entity Relationship Diagram (ERD), creating a database schema, importing CSV data, and running SQL queries to answer key analytical questions.
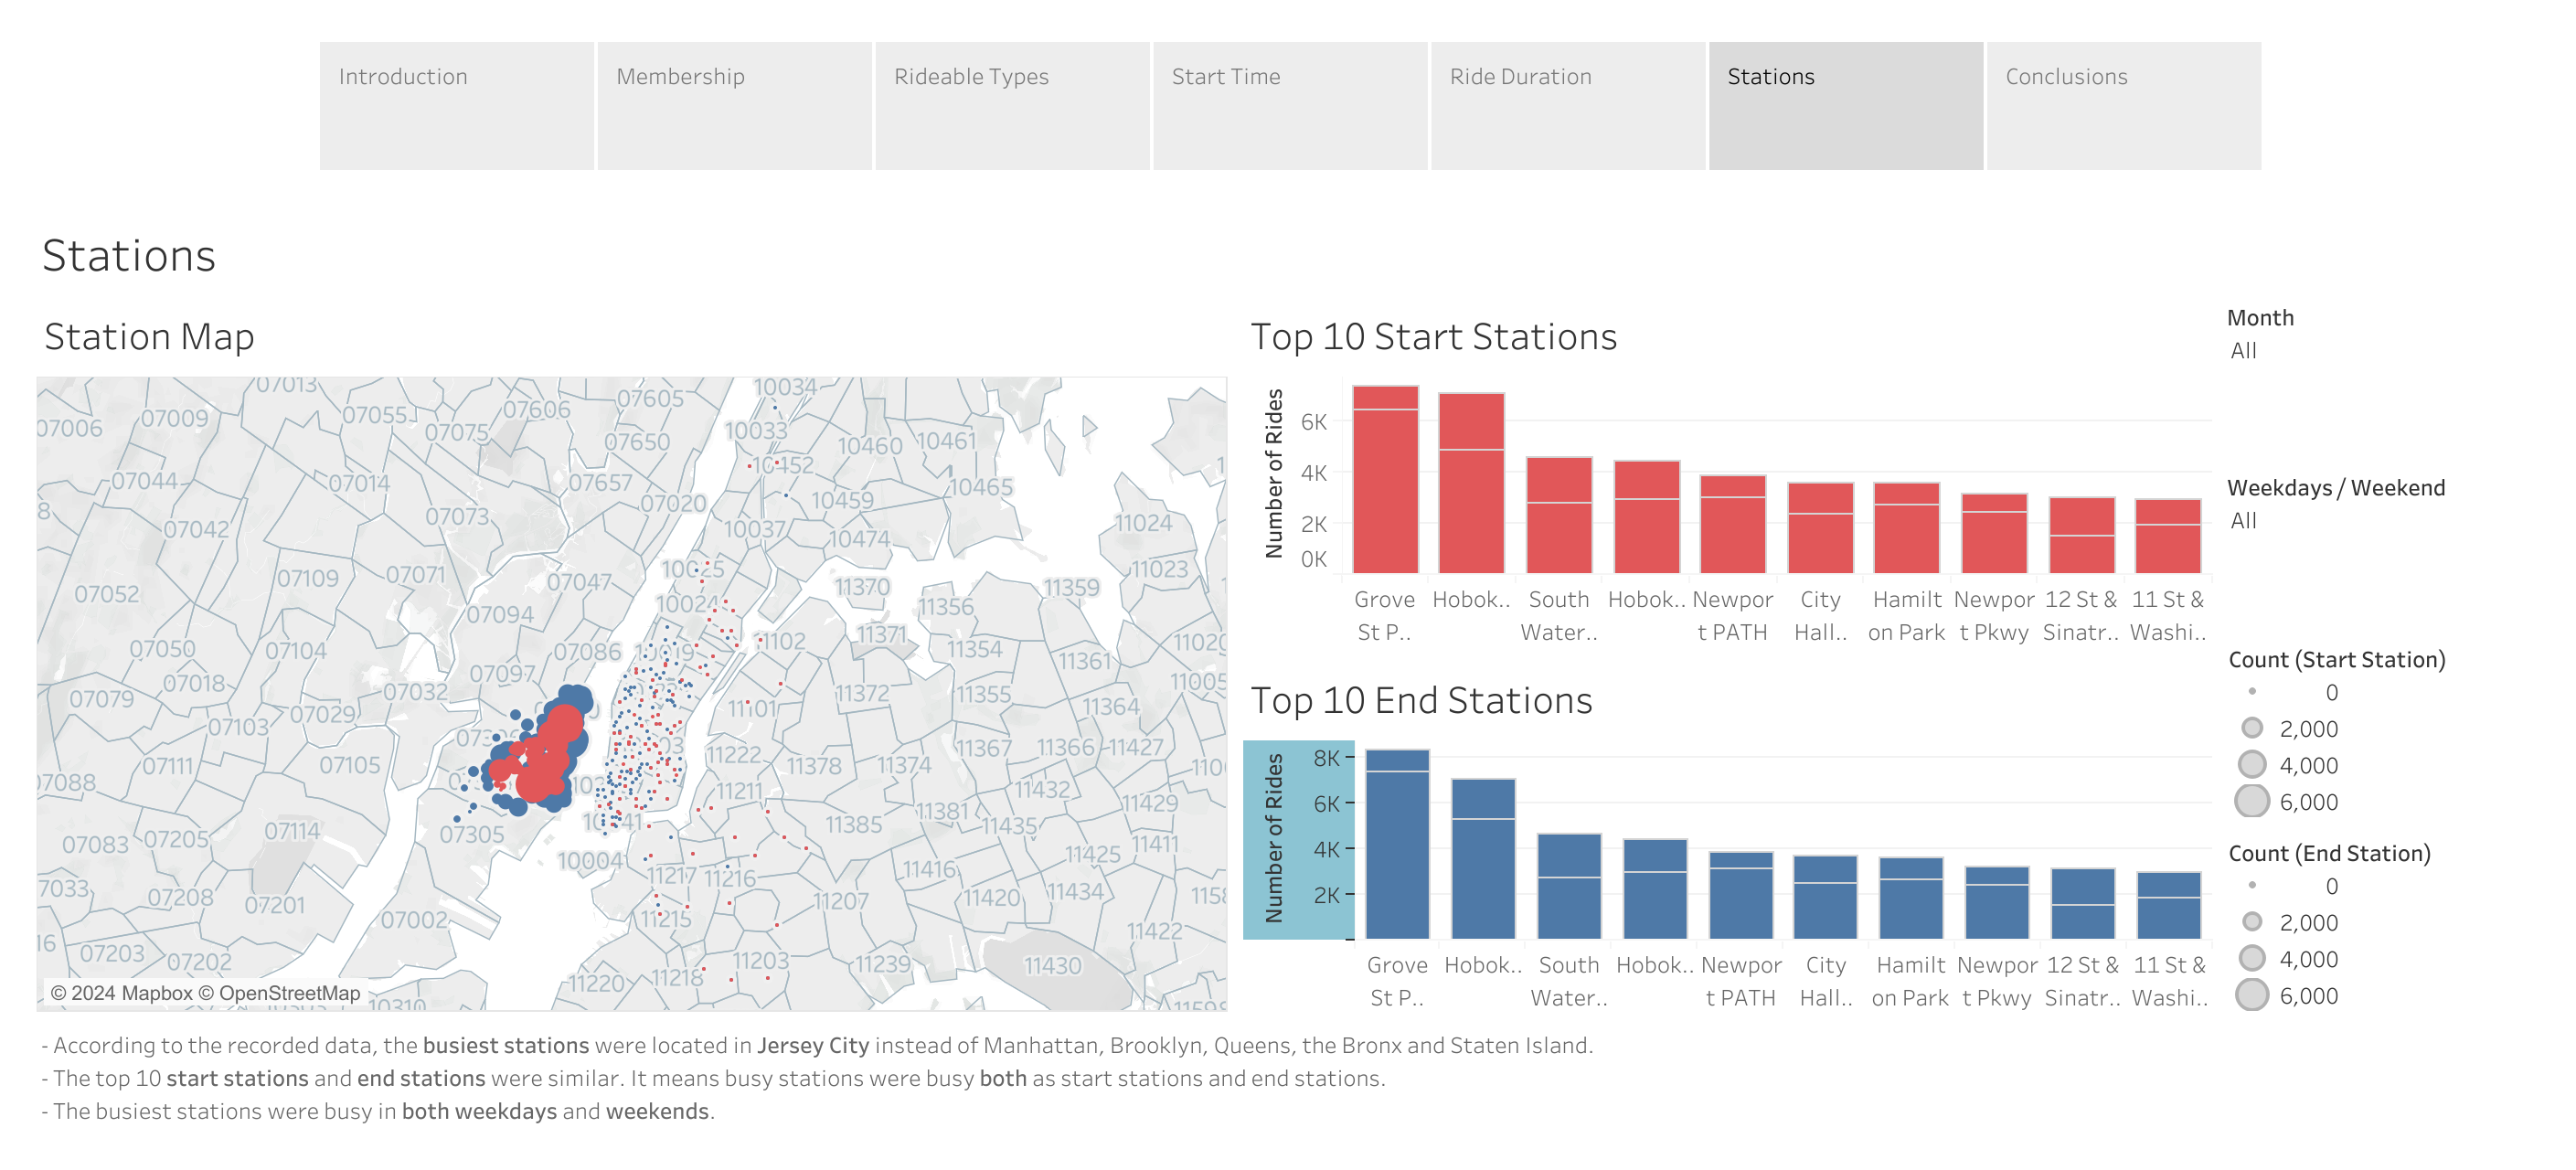
Tableau Workbook on Bike Ridership Patterns
This workbook features a story with five interactive dashboards to highlight patterns in Citi Bike ridership. It is tailored for non-technical readers, enabling easy understanding and insightful analysis of the data.
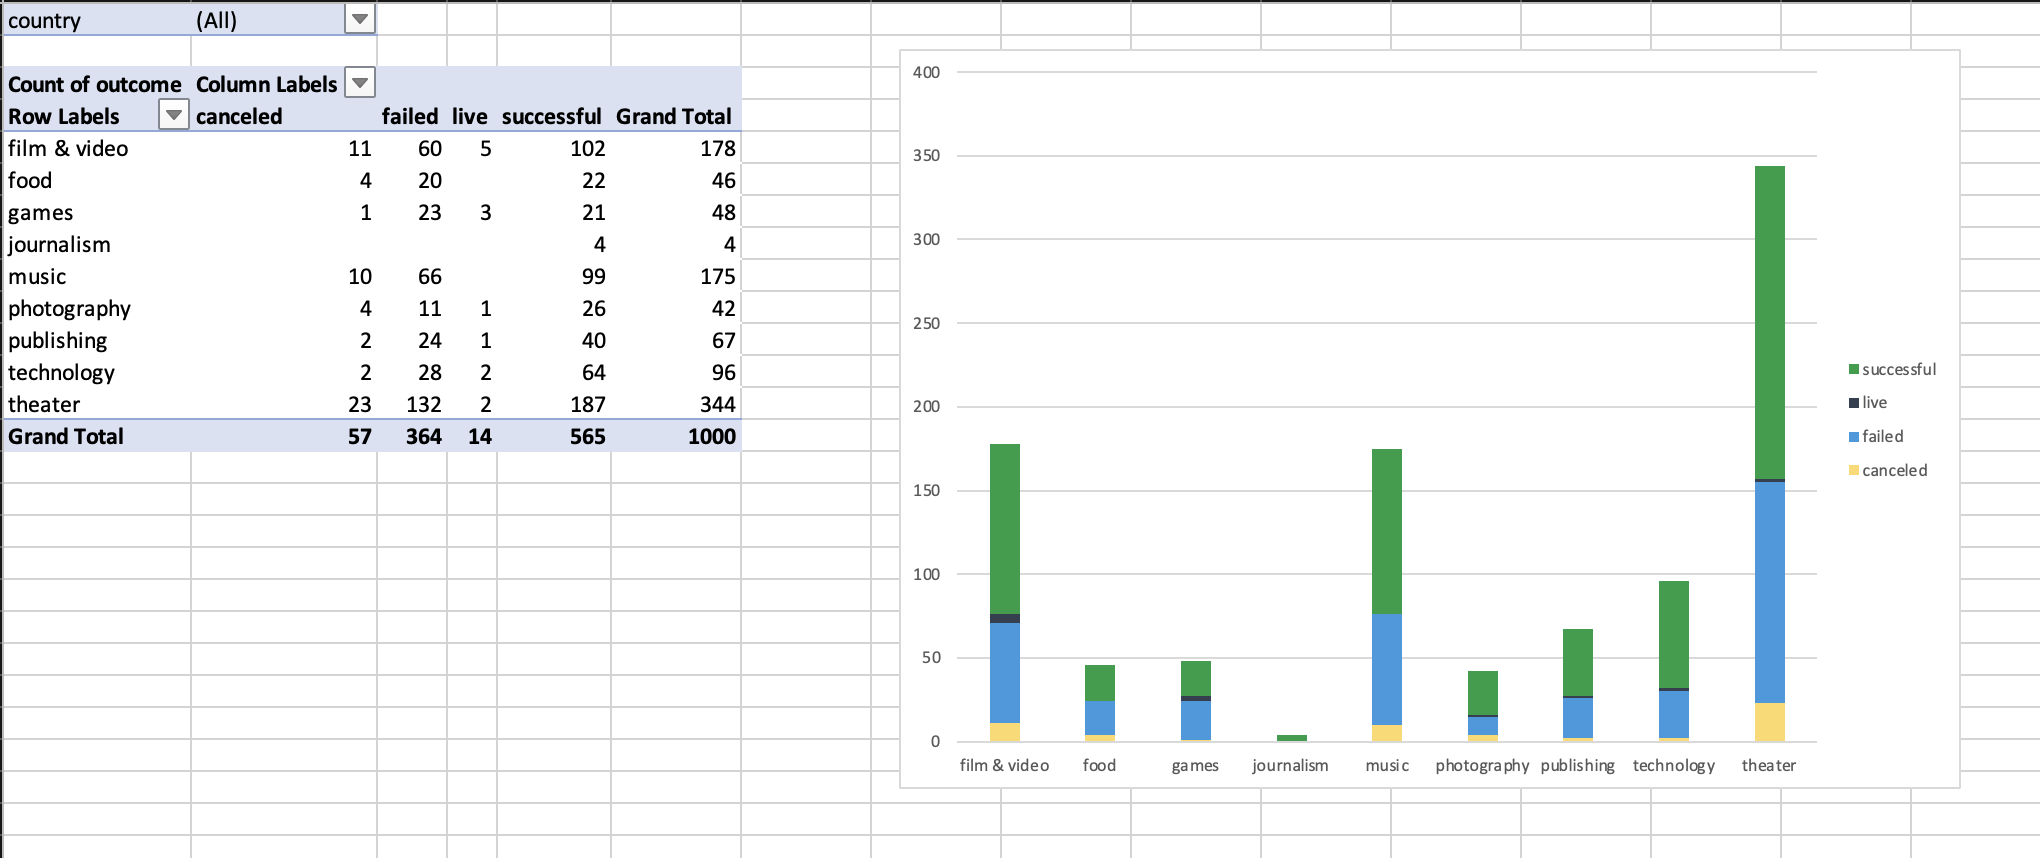
Analysis of Campaign Data from 1,000 Crowdfunding Projects
Crowdfunding campaign data has been processed to uncover insights into market trends and related metrics. Conditional formatting, formulas, pivot tables, and charts were used to reveal the relationship between campaign goals and outcomes.
Data can often be vast, unstructured, and difficult to interpret, making it challenging to extract actionable insights. My approach to data analytics is rooted in transforming raw data into clear, meaningful information, with the needs and goals of the audience in mind. By applying advanced analytical techniques and intuitive visualisations, I uncover key trends and relationships, simplifying complex data to empower organisations and individuals to make informed, impactful decisions.
Understand your data trends and patterns.
Effectively convey insights to stakeholders.
Clean and structure data for analysis.
Leverage predictive models for future insights.
Store, retrieve, and manage data efficiently.
Protect sensitive information with robust measures.